EspaƱol

Sitio alojado en USB

Master's degree in Telecommunications Engineering


Path loss attenuation calculator for 5G frequencies


3GPP TR 38.901 (14.3.0 version Jan. 2018)

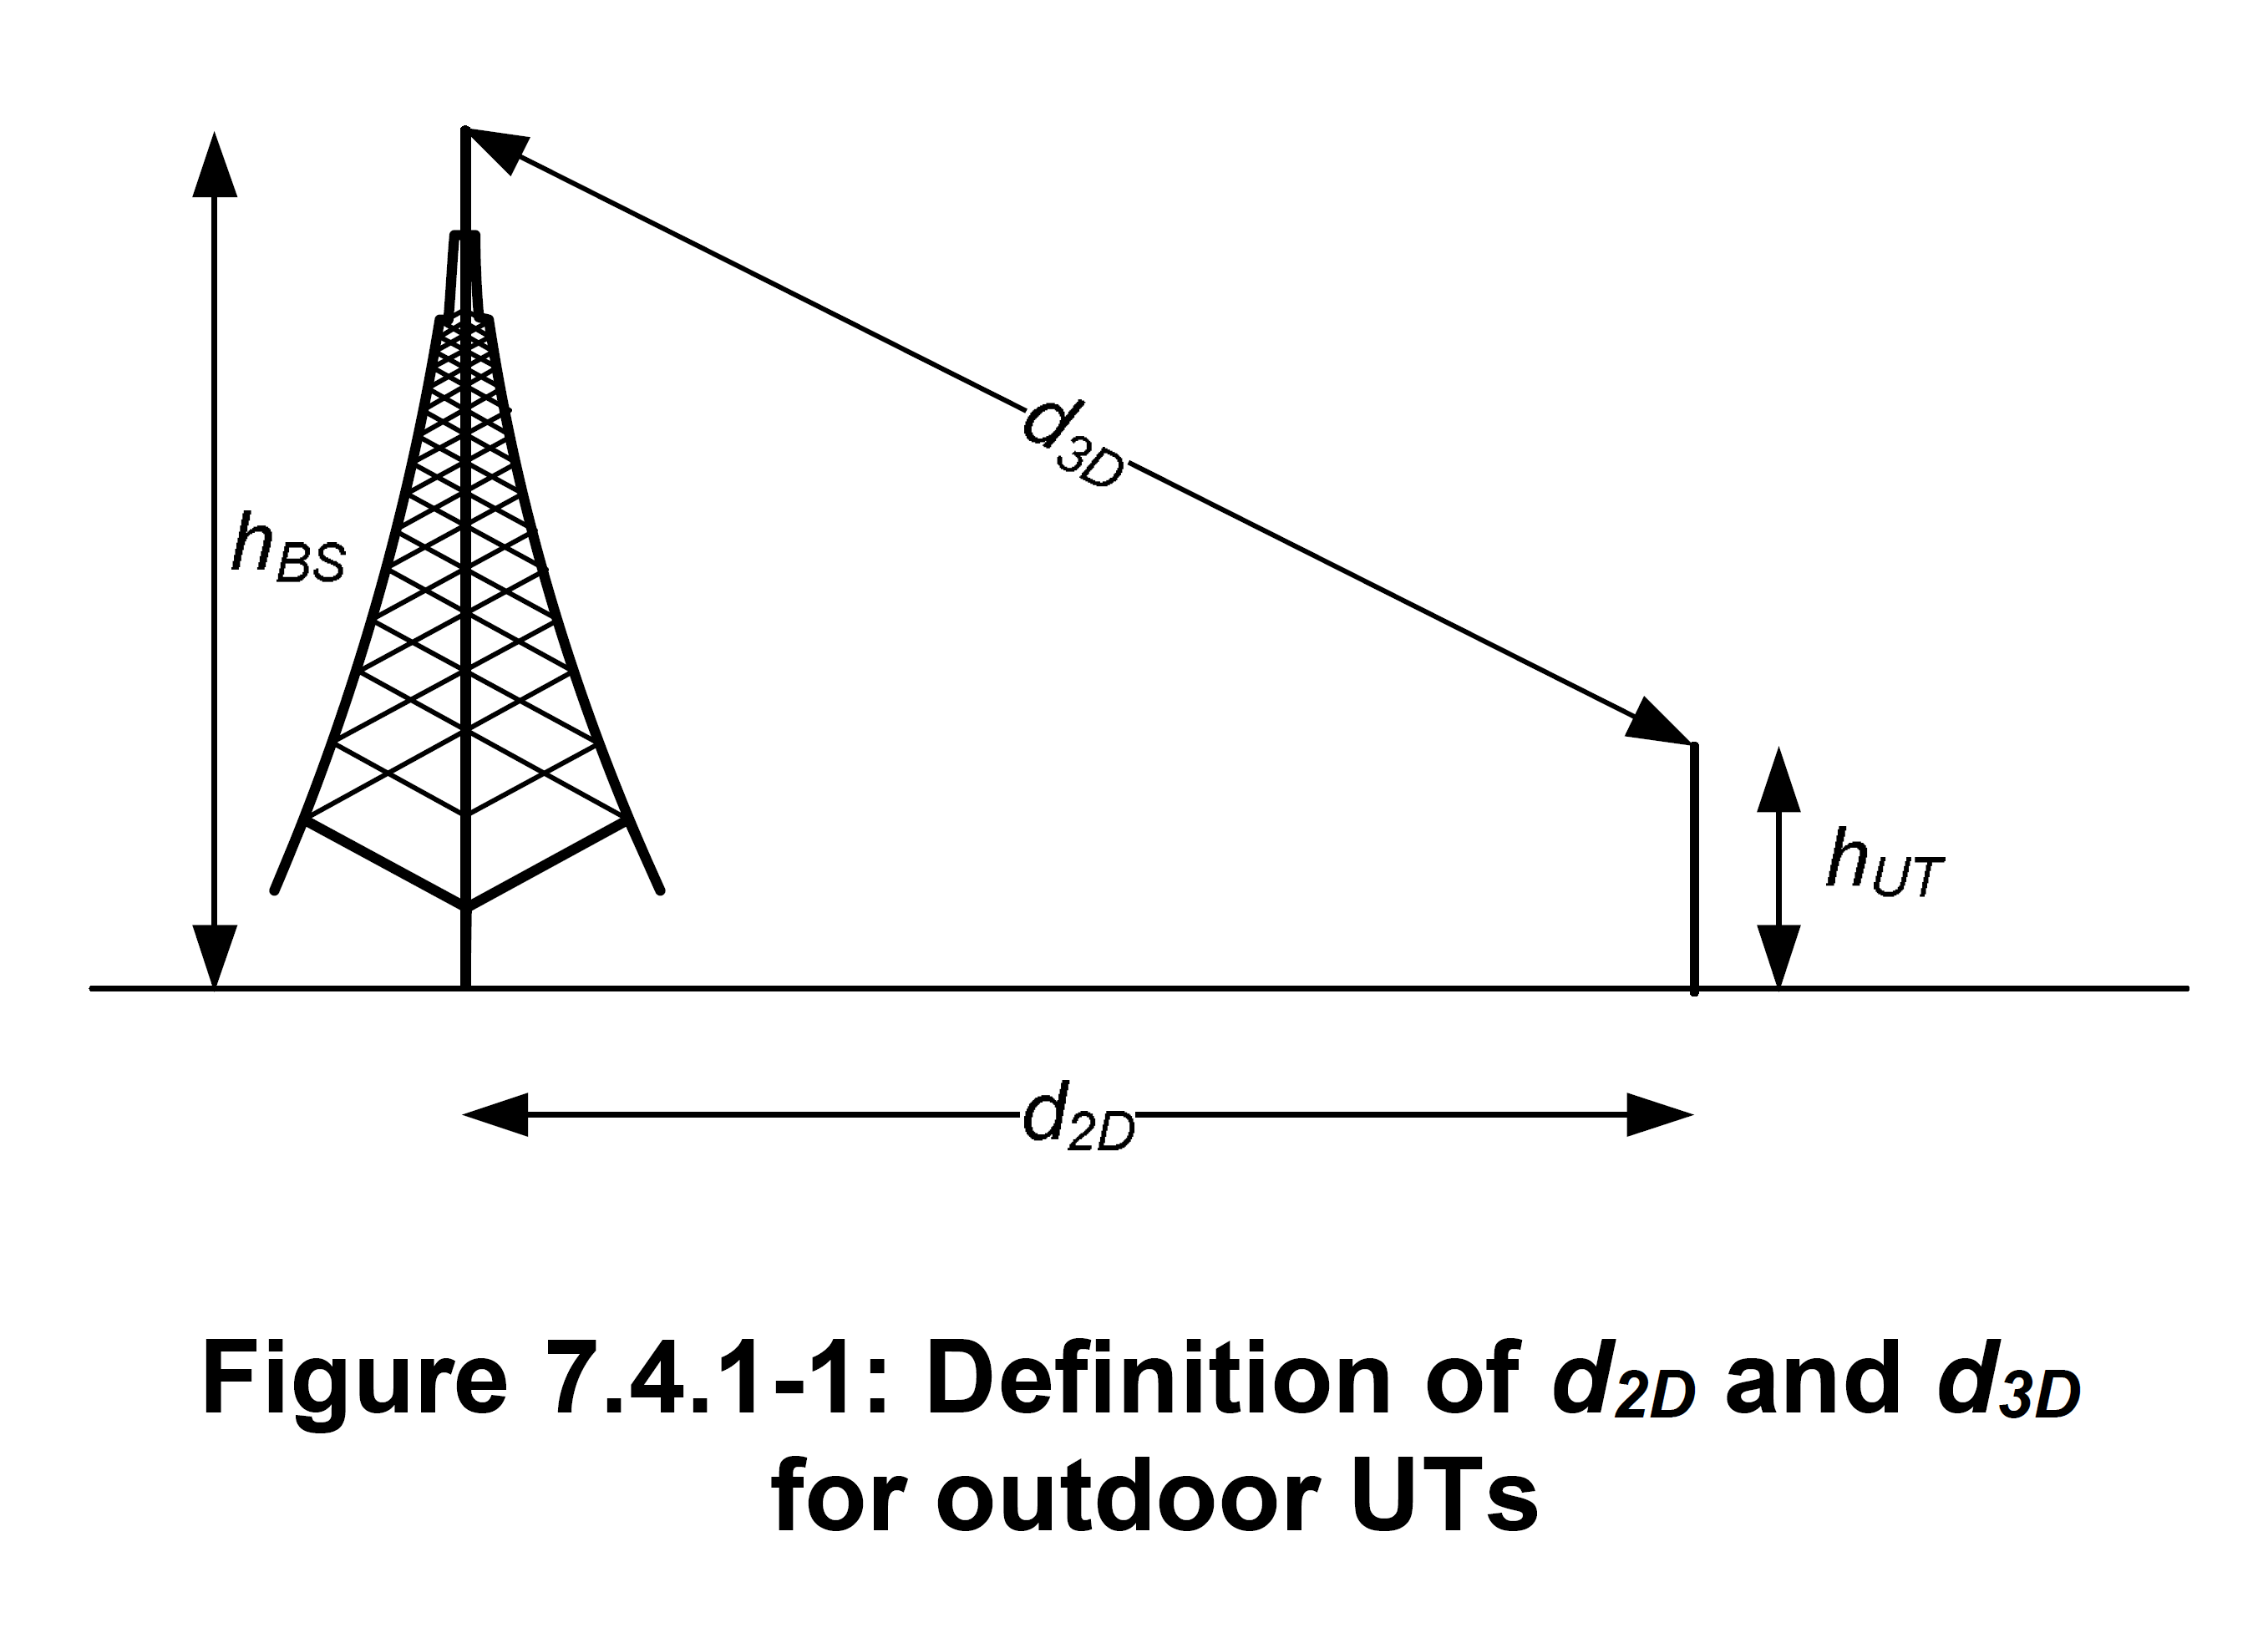
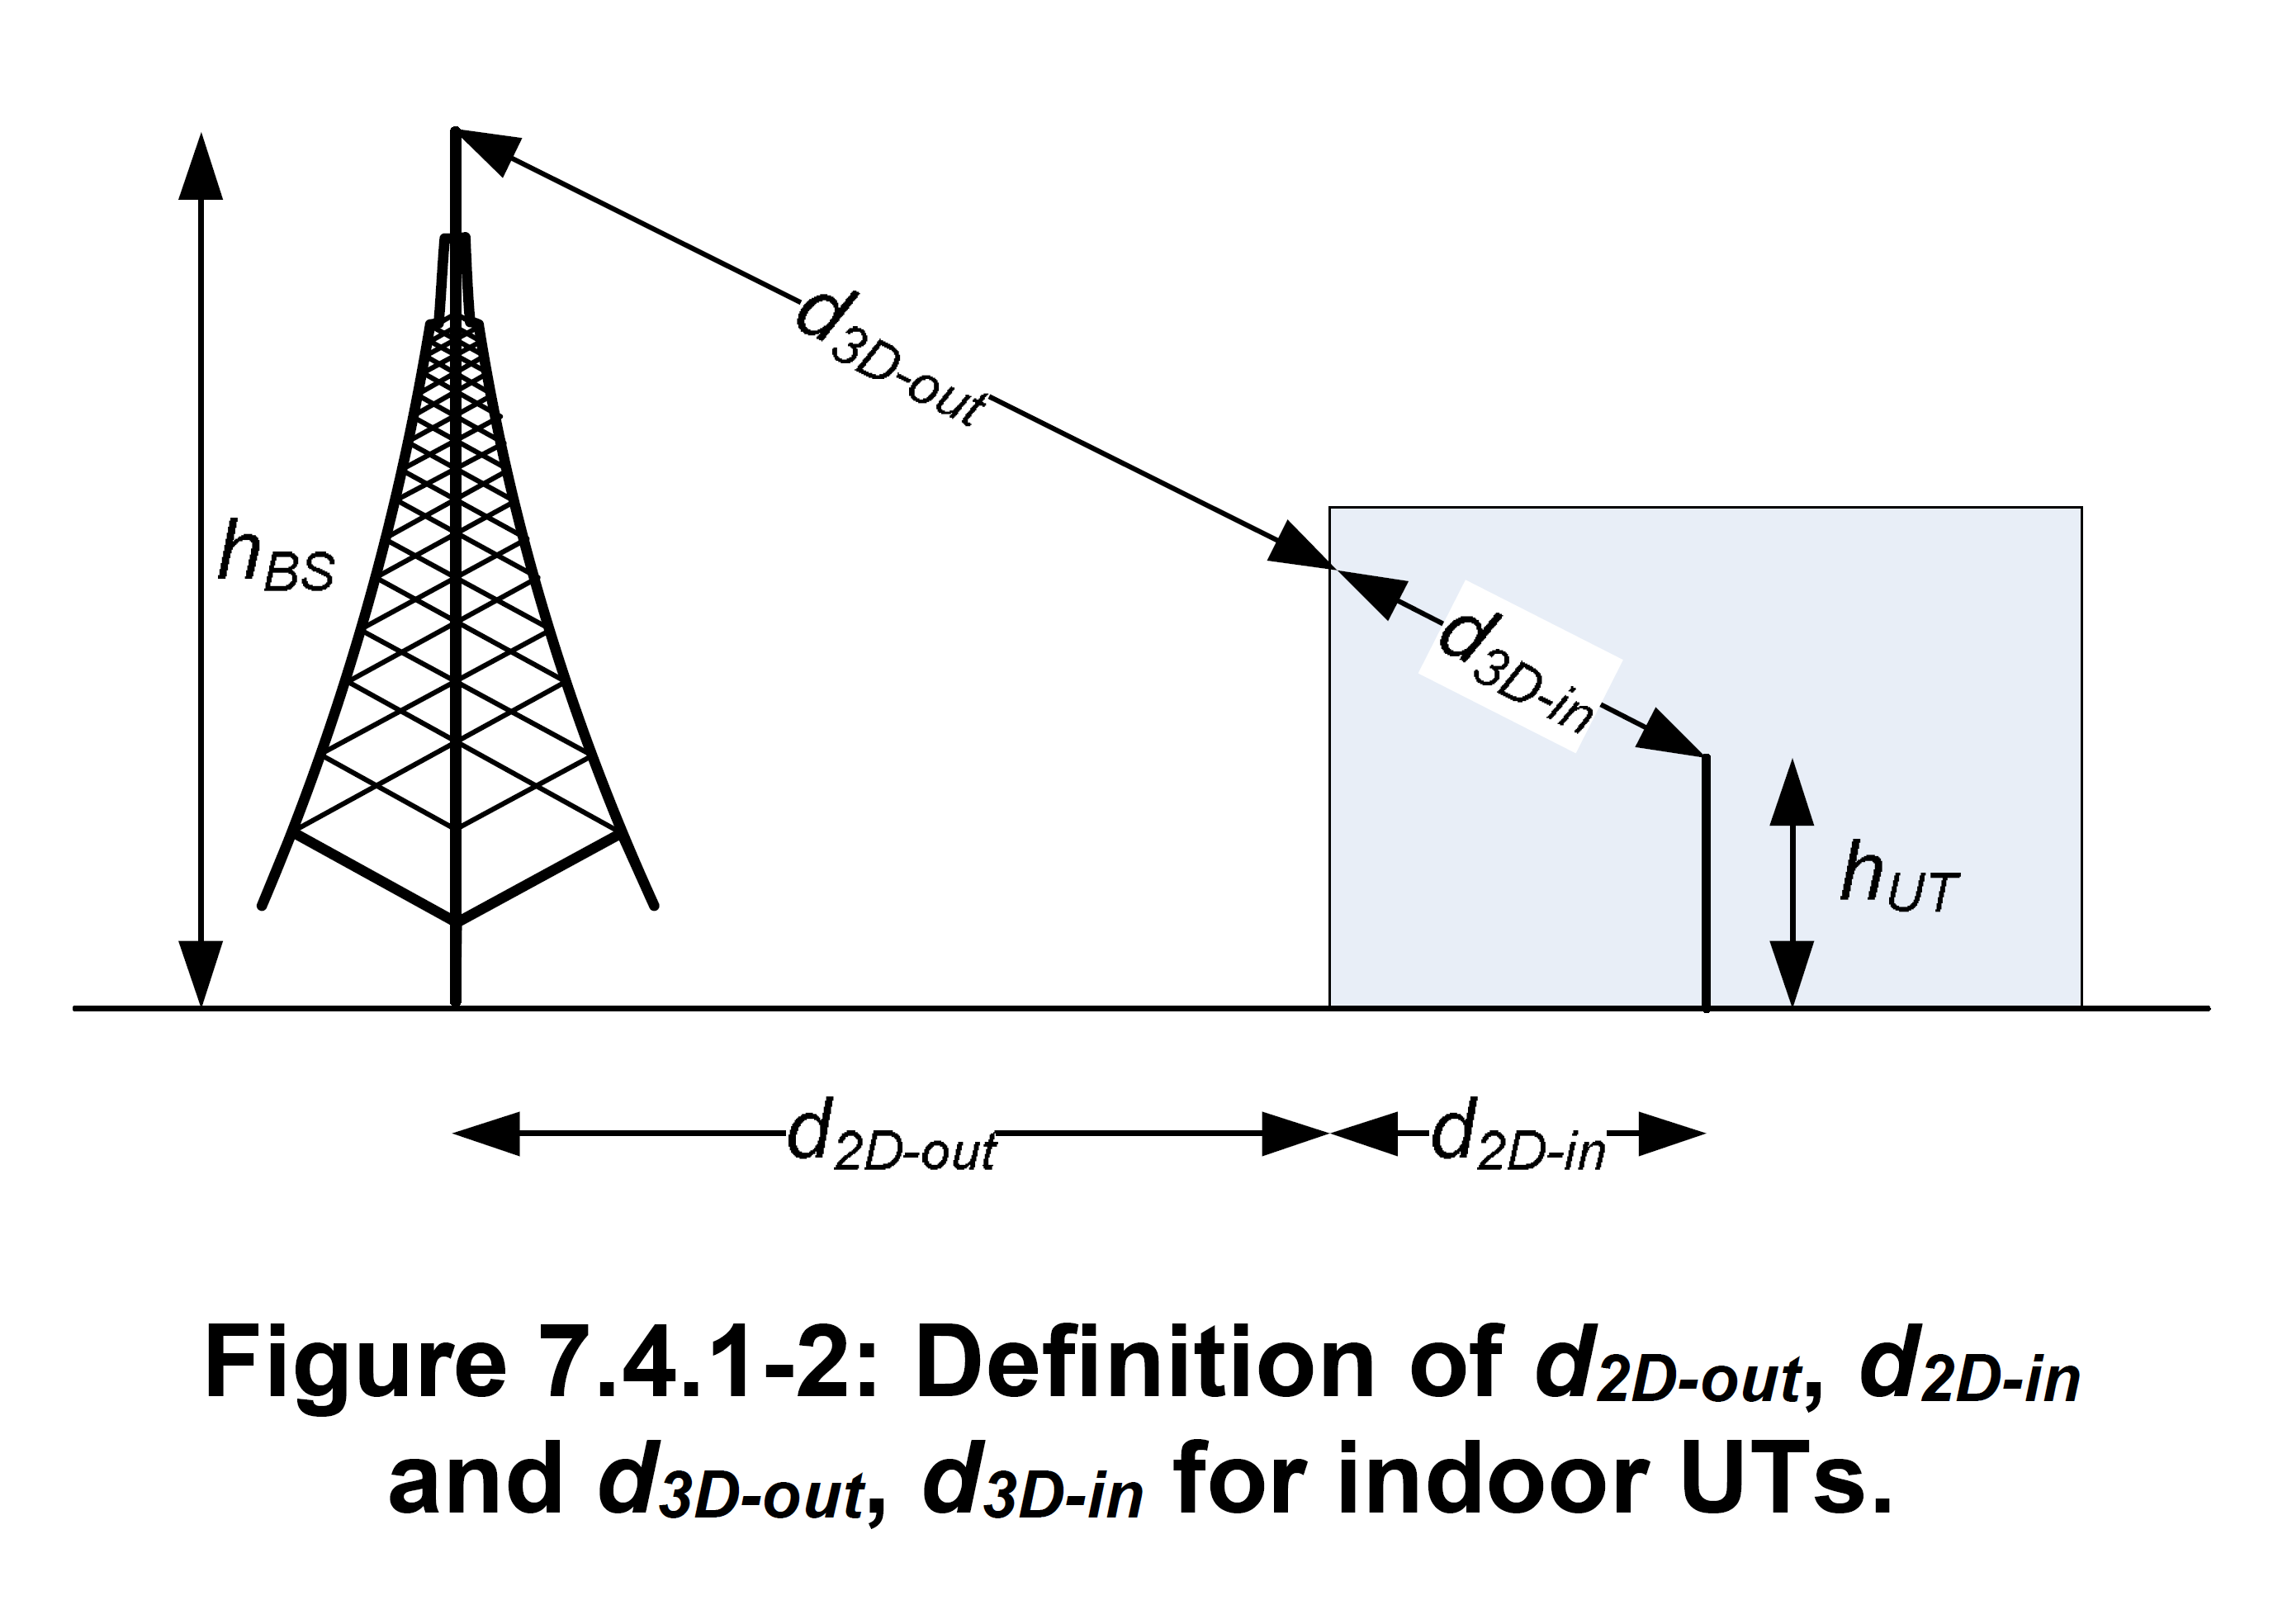
The path loss models are summarized in Table 7.4.1-1 and the distance definitions are indicated in Figure 7.4.1-1 and Figure 7.4.1-2. The shadow fading has a log-normal distribution, and the Table 7.4.1-1 provides the standard deviations for each scenario.

d2D
2D distance between Tx and Rx
d3D
3D distance between Tx and Rx
fc
center frequency / carrier frequency
hBS
antenna height for BS
hUT
antenna height for UT
h
average building height
W
average street width